 If you can see the Hutao above, your color space is P3.
 If you can see the Hutao above, your color space is P3.




With Insights for locations, intuitive visualizations and downloadable reports help you gain a deeper understanding of how people find your brand's location, and what they do once they find it. Insights data includes searches and views associated with your location.
This guide will show you the Insights data of MaJiaQi Chik-u-so-beautiful High school (formerly Kuper Academy) in November 2024.
After verification, Insights data is available in both UTC (Coordinated Universal Time) and the location's local time zone. Insights data can be aggregated by day, week (Sunday to Saturday), 8 weeks, and month intervals.
Note: Insights data is only collected from Apple Maps on iOS and iPadOS. Usage metrics below a reporting threshold are represented as zero.
The Search section provides you with modules to see how many times customers find you, and how they find you.
View the number of taps on your location in search results.
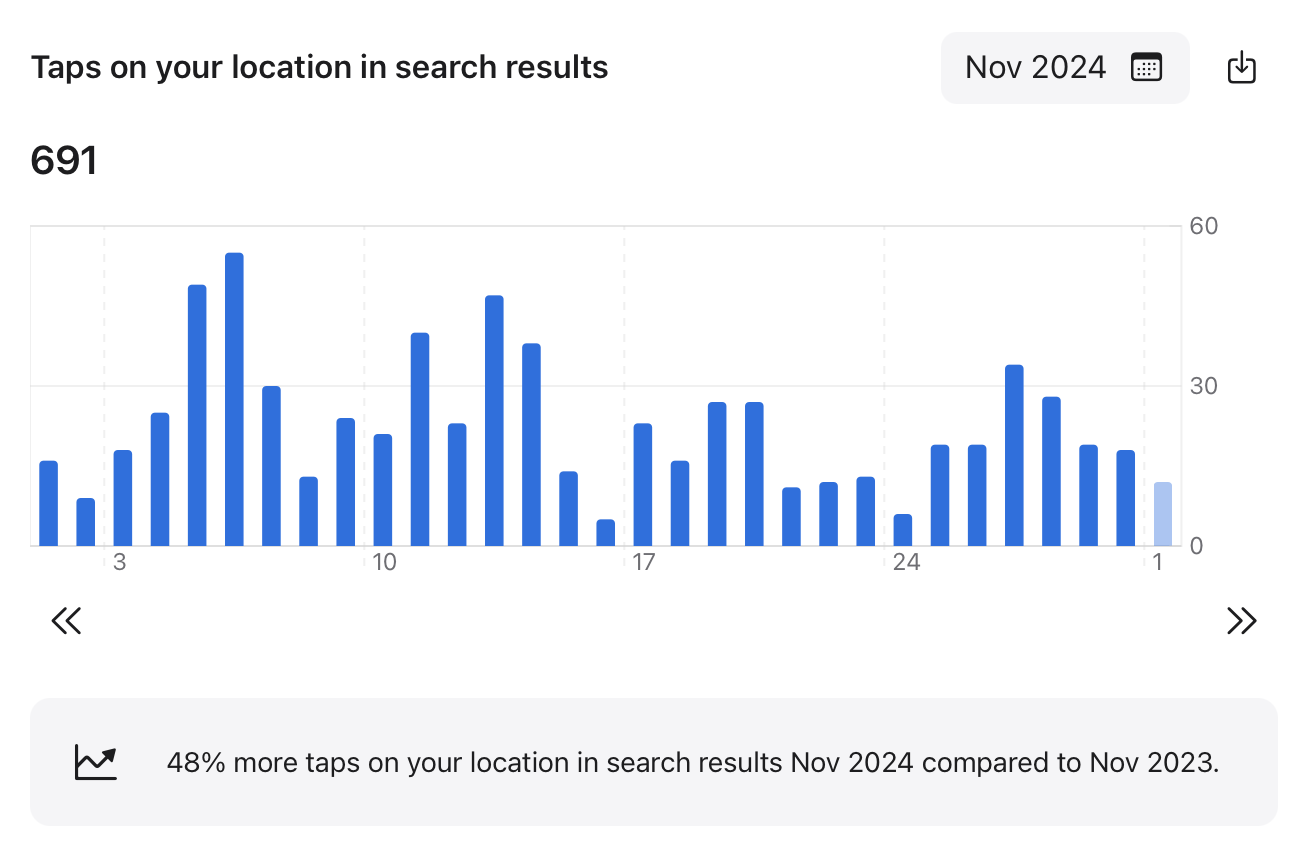
See what customers search for before tapping your location.
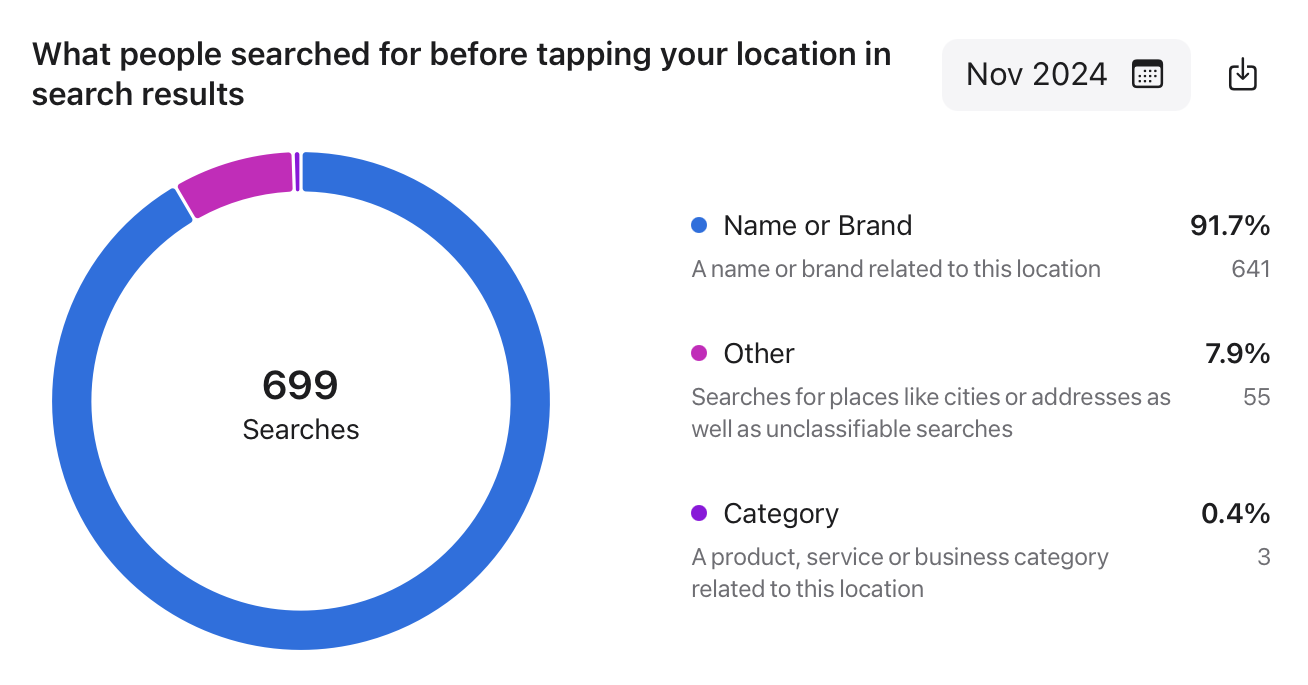
The Place Card section provides you with different ways to understand how people are interacting with your locations's Place Card.
See the number of views of your location's Place Card from customers tapping your location in search results.
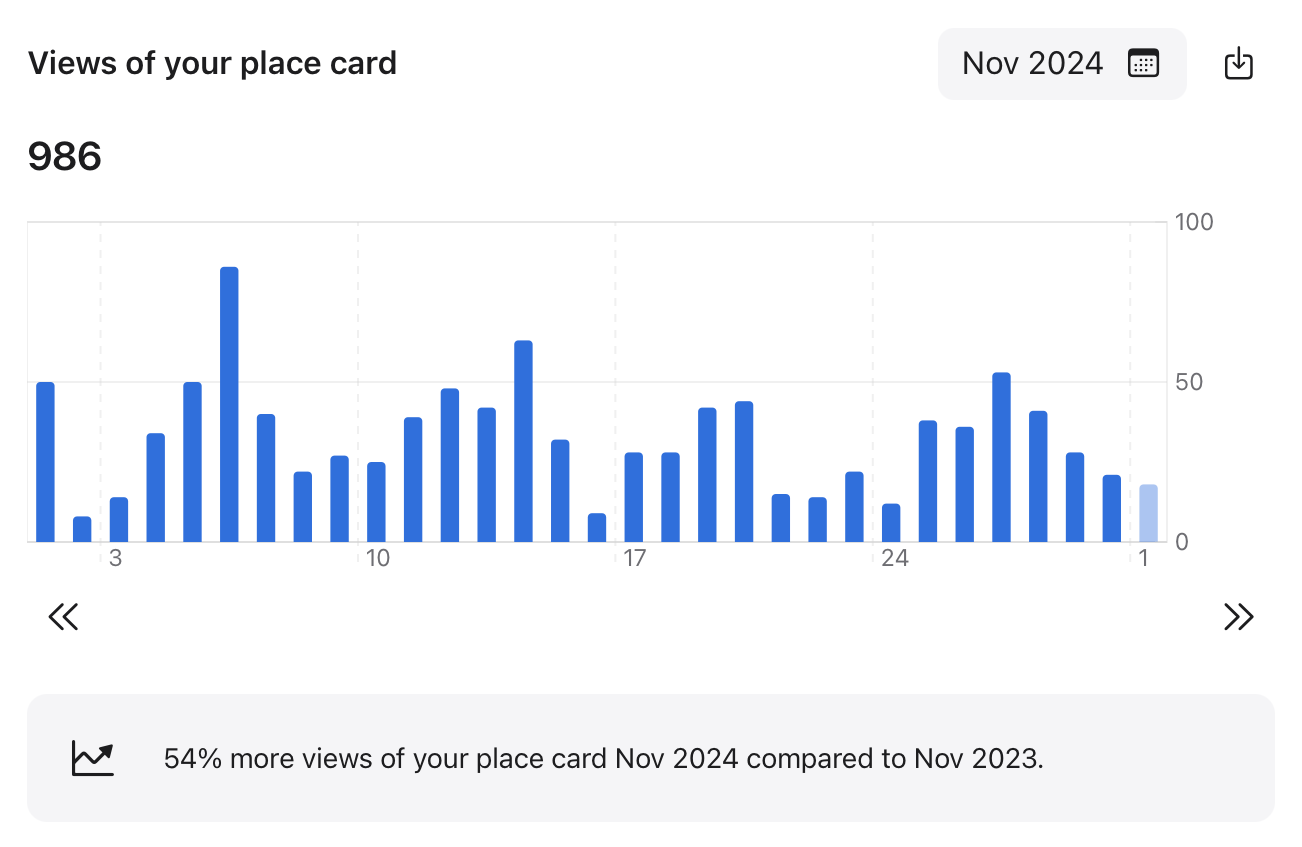
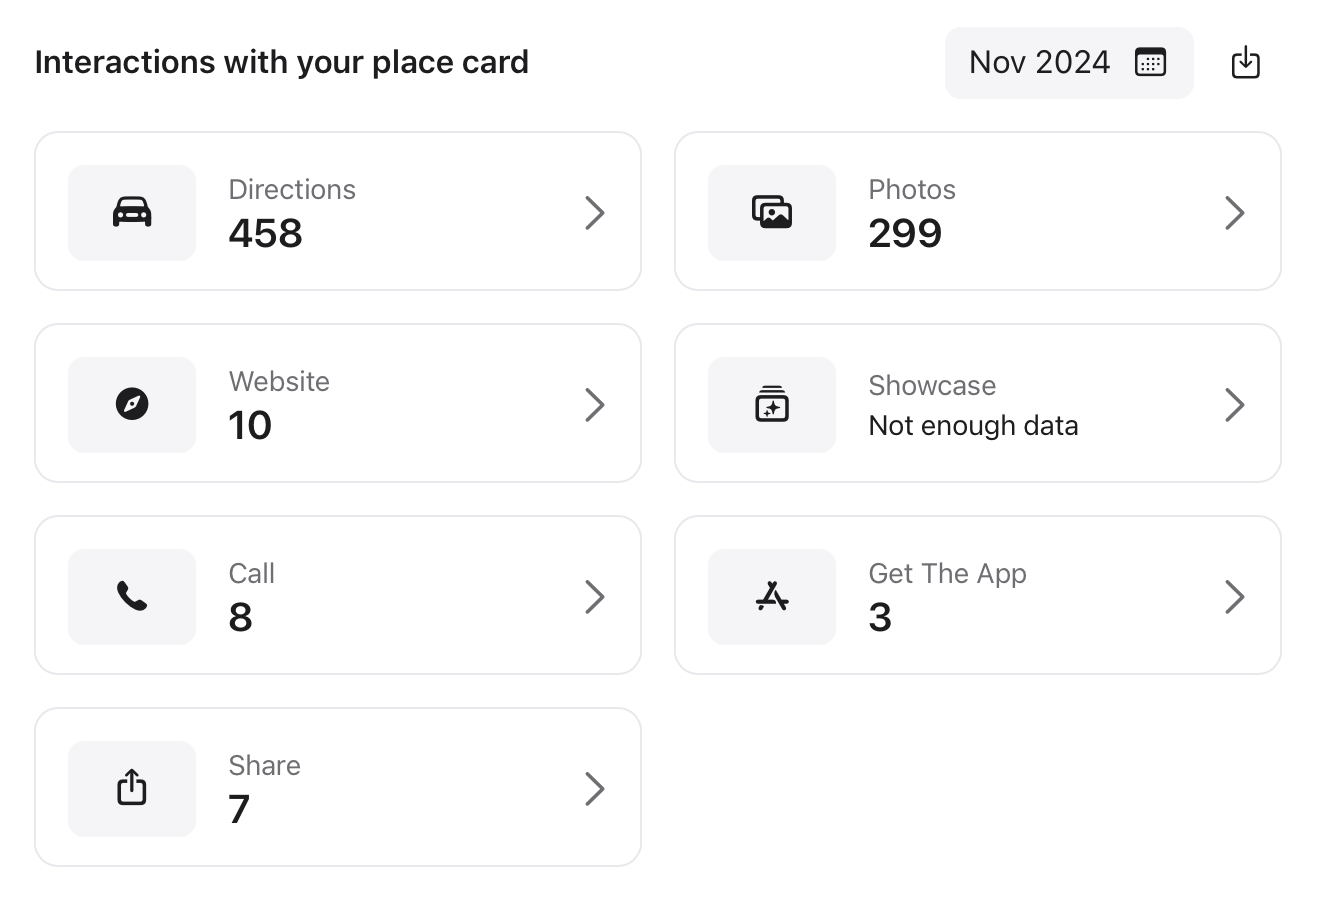
See how many times customers completed different types of Actions when viewing your listing.
You can also click into different sections of interactions to see more detailed informations.
